Forecasting product demand from customers is central to what Amazon does. It helps ensure that products reach customers on time, that inventory management in fulfillment centers is efficient, and that sellers have predictable shipping schedules.
Forecasting models may be trained on data from multiple sellers and multiple products, but their predictions are typically one-dimensional: the forecast for a given product, for a given seller, is based on past demand for that product from that seller.
But one-dimensional analyses can leave out information crucial to accurate prediction. What will it do to demand if a competitor goes out of stock on a particular product? Or, conversely, what if a competitor’s release of a new product causes the whole product space to heat up?
At this year’s European Conference on Machine Learning (ECML), we proposed a new method for predicting product demand that factors in correlations with other sellers and products at prediction time as well as training time. Unlike previous attempts at multidimensional demand forecasting, our method uses graphs to represent those correlations and graph neural networks to produce representations of the graphical information.
In experiments, our approach increased prediction accuracy by 16% relative to standard, one-dimensional analyses. The benefits were particularly pronounced in cases in which multiple sellers were offering the same product — a relative improvement of almost 30% — and “cold-start” products for which less than three months of historical data were available — a relative improvement of almost 25%.
Graphical models
In e-commerce, products are often related in terms of categories or sub-categories, and their demand patterns are thus correlated. When a neural-network-based forecasting model is trained on datasets containing correlated products, it learns to extract higher-order features that implicitly account for some of those correlations.
It stands to reason, however, that looking at other time series may be beneficial at prediction time, too. In this work, we have developed a more systematic method of modeling the correlations between different entities across time series using graph neural networks.
A graph consists of nodes — usually depicted as circles — linked by edges — usually depicted as line segments connecting nodes. Edges can have associated values, which indicate relationships between nodes.

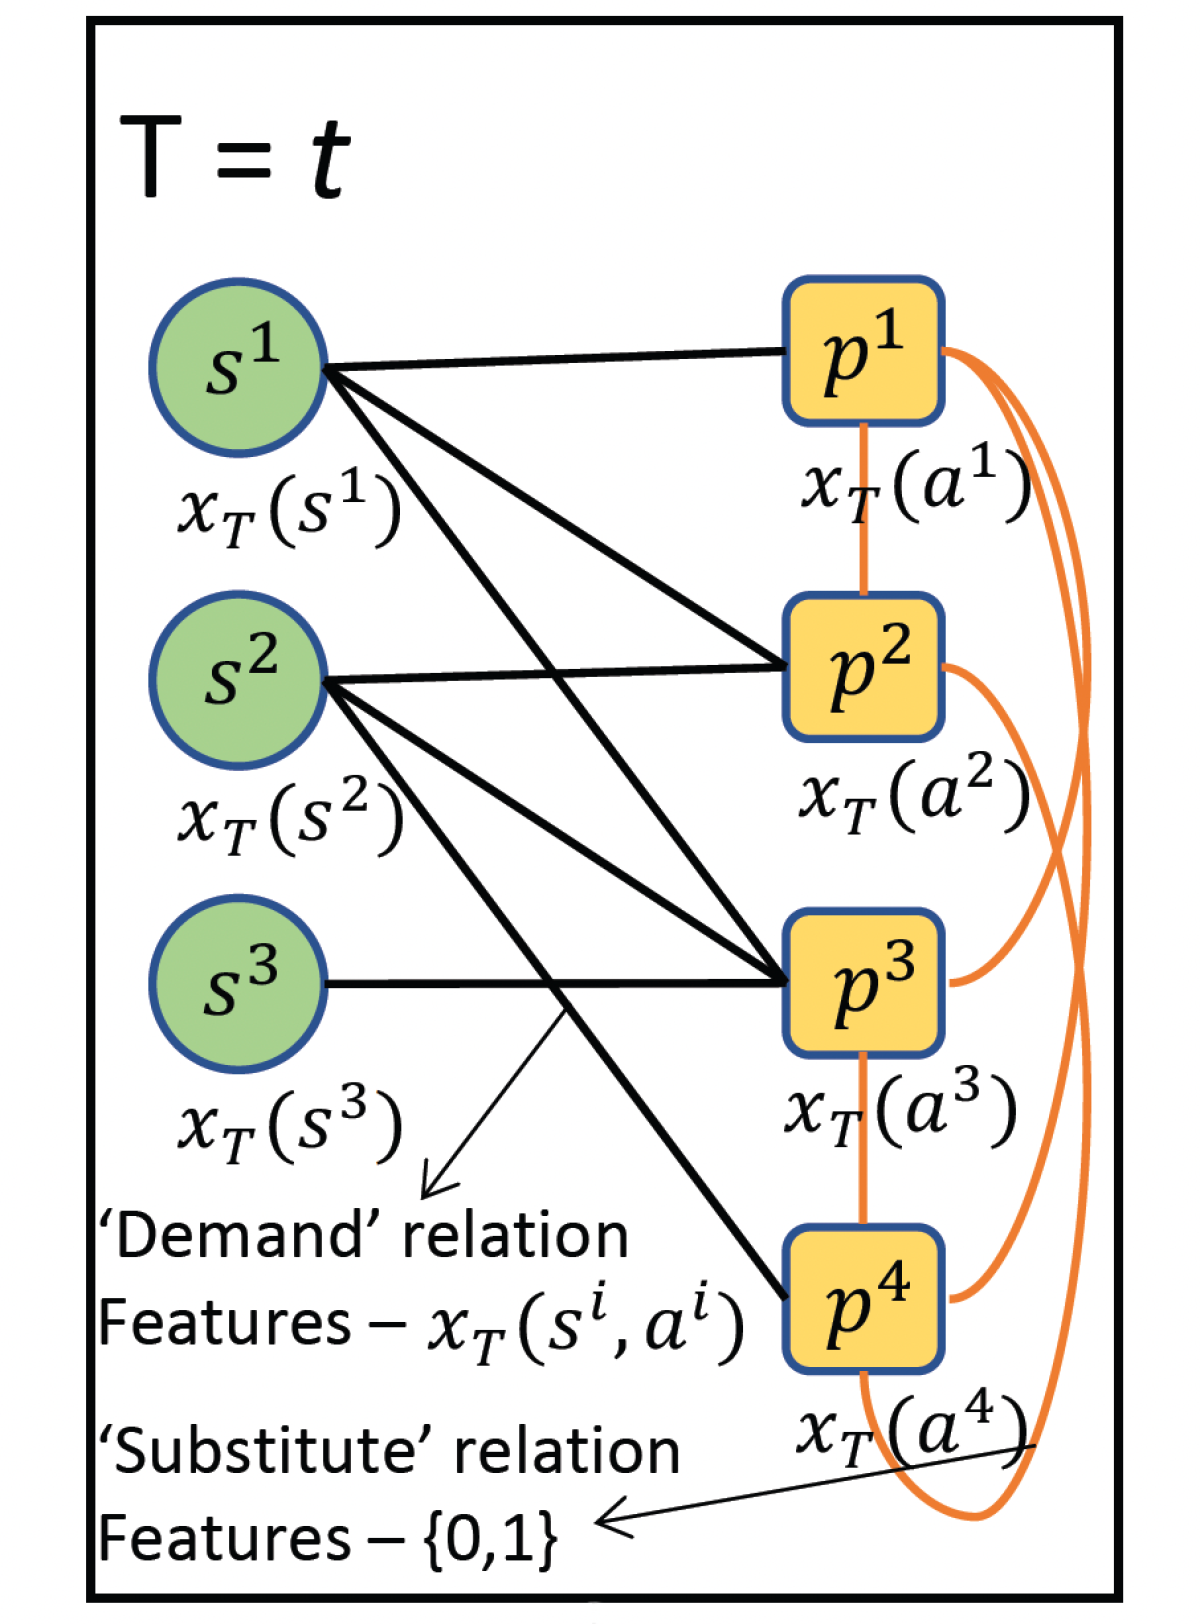
We represent correlations between product and seller data with a graph that has two types of nodes — products and sellers— and two types of edges — demand relations and substitute relations. Demand edges link sellers to products, while substitute edges link products to each other.
Associated with each node is a feature vector, representing particular attributes of that product or seller. Product-specific features include things like brand, product category, product sales, number of product views, and the like. Seller-specific features include things like seller rating, seller reviews, total customer orders for the seller, and total views of all the products offered by a seller.
Associated with each demand edge is another feature vector representing relationships between sellers and products, such as total views of a particular product offered by the seller, total customer orders of that product for the seller, whether the seller went out of stock on that product, and so on.
Associated with each substitute edge is a binary value, indicating whether the products can be substituted for each other, as evidenced by customer choice.
For every time step in our time series, we construct such a graph, representing the feature set at that time step.
The neural model
The graph at each time step in our time series passes through a graph neural network, which produces a fixed-length vector representation of each node in the graph, or embedding. That representation accounts for the features of the node’s neighbors and the edges connecting them, as well.
The outputs of the graph neural network are concatenated with static features for each time step, such as the number of days until the next major holiday or special financing offers from banks.
The combined representations are then passed, in sequence, to a network with an encoder-decoder architecture. The encoder comprises a sequential network such as a temporal convolutional network (TCN) or a long-short-term-memory (LSTM) network, which captures characteristics of the historical demand data. The encoder’s output represents the entire time series, factoring in dependencies between successive time steps.
That representation is passed to a decoder module that produces the final prediction.

The whole model is trained end to end, so that the graph neural network and the encoder learn to produce representations that are useful for the final prediction, when conditioned on the static features.
Results
We experimented with four different types of graph neural networks (GNNs):
- homogeneous graph convolutional networks, in which node features are standardized so that all nodes are treated the same;
- GraphSAGE networks, which reduce the computational burden of processing densely connected graphs by sampling from each node’s neighbors;
- heterogeneous GraphSAGE networks, which can handle different types of nodes; and
- heterogeneous graph attention networks, which assign different weights to a given node’s neighbors.
We also experimented with different inputs to each type of GNN: nodes only; nodes and demand edges; and nodes and demand and substitute edges. Across models, the addition of more edge data improved performance significantly, demonstrating that the models were taking advantage of the graphical representation of the data. Across input types, the graph attention network performed best, so our best-performing model was the graph attention network with both types of edge information.


