Many machine learning (ML) applications involve embedding data in a representation space, where the geometric relationships between embeddings carry semantic content. Performing a useful task often involves retrieving an embedding’s proximate neighbors in the space: for instance, the answer embeddings near a query embedding, the image embeddings near the embedding of a text description, the text embeddings in one language near a text embedding in another, and so on.
A popular way to ensure that retrieved examples accurately represent the intended semantics is deep metric learning, which is commonly used to train contrastive-learning models like the vision-language model CLIP. In deep metric learning, the ML model learns to structure the representation space according to a specified metric, so as to maximize the distinction between dissimilar training samples while promoting proximity among similar ones.
One drawback of deep metric learning (DML), however, is that both the distances between embeddings of the same class and the distances between different classes of embeddings can vary. This is a problem in many real-world applications, where you want a single distance threshold that meets specific false-positive and false-negative rate requirements. If both the interclass and intraclass distances vary, no single threshold is optimal in all cases. This can cause substantial deployment complexities in large-scale applications, as individual users may require distinct threshold settings.
At this year’s International Conference on Learning Representations (ICLR), my colleagues and I presented a way to make the distances between DML embeddings more consistent, so that a single threshold will yield equitable fractions of relevant results across classes.
First, we propose a new evaluation metric for measuring DML models’ threshold consistency, called the operating-point-inconsistency score (OPIS), which we use to show that optimizing model accuracy does not optimize threshold consistency. Then we propose a new loss term, which can be added to any loss function and backbone architecture for training a DML model, that regularizes distances between both hard-positive intraclass and hard-negative interclass embeddings, to make distance thresholds more consistent. This helps to ensure consistent accuracy across customers, even amid significant variations in their query data.
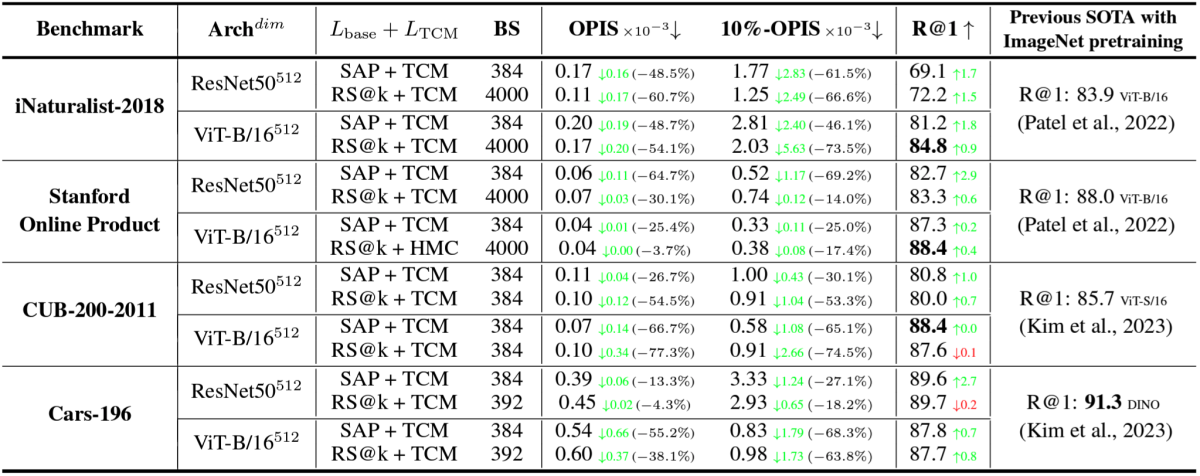
To test our approach, we used four benchmark image retrieval datasets, and with each one we trained eight networks: four of the networks were residual networks, trained with two different loss functions, each with and without our added term; the other four were vision transformer networks, also trained with two different state-of-the-art DML loss functions, with and without our added term.
In the resulting 16 comparisons, the incorporation of our loss term notably enhanced threshold consistency across all experiments, reducing the OPIS inconsistency score by as much as 77.3%. The integration of our proposed loss also led to improved accuracy in 14 out of the 16 comparisons, with the greatest margin of improvement being 3.6% and the highest margin of diminishment being 0.2%.
Measuring consistency
DML models are typically trained using contrastive learning, in which the model receives pairs of inputs, which are either of the same class or of different classes. During training, the model learns an embedding scheme that pushes data of different classes apart from each other and pulls data of the same class together.
As the separation between classes increases, and the separation within classes decreases, you might expect that the embeddings for each class become highly compact, leading to a high degree of distance consistency across classes. But we show that this is not the case, even for models with very high accuracies.
Our evaluation metric, OPIS, relies on a utility score that measures a model’s accuracy at different threshold values. We use the standard F1 score, which factors in both the false-acceptance and false-rejection rate, where a weighting term can be added to emphasize one rate over the other.
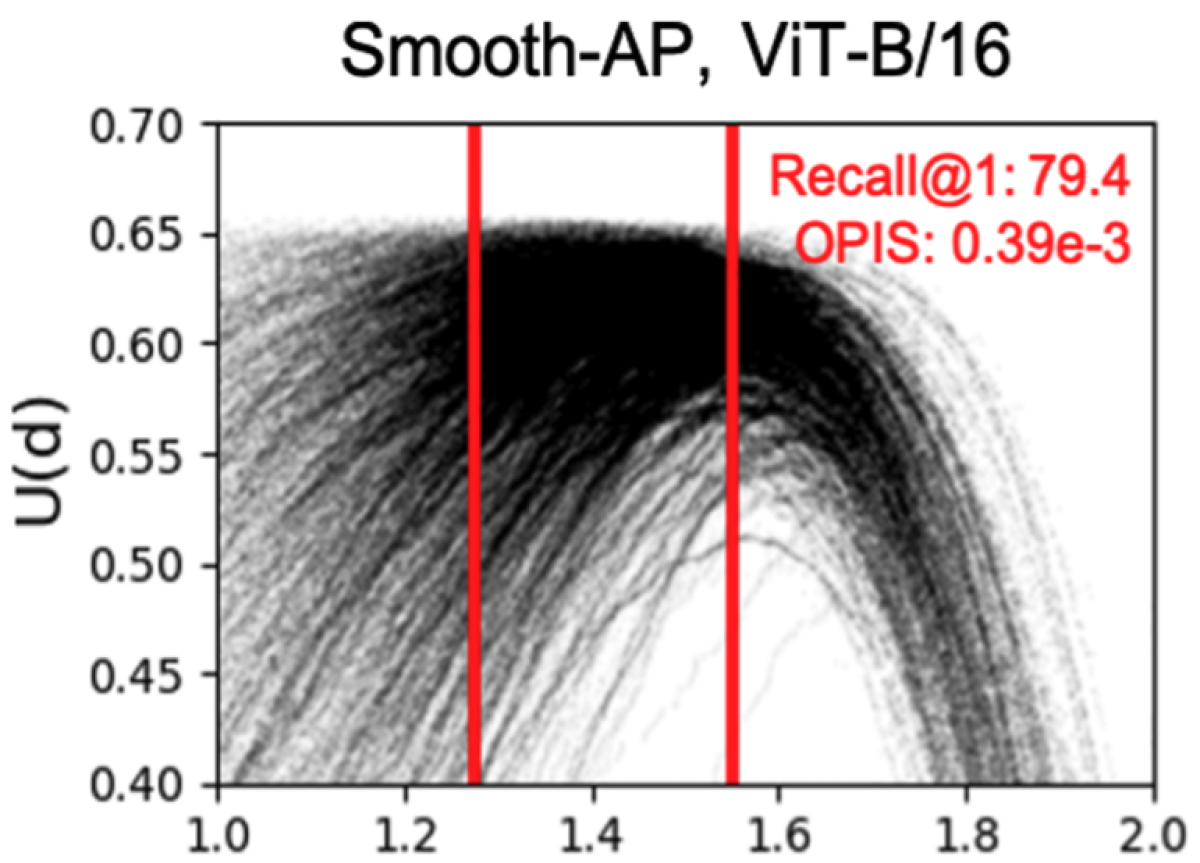
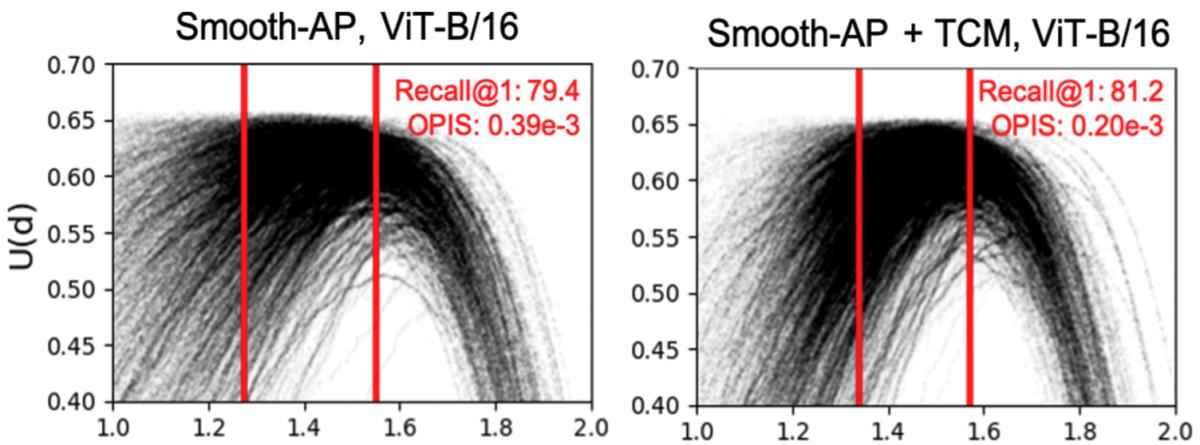
Then we define a range of threshold values, which we call the calibration range, which is typically based on the target performance metric in some way. For instance, it might be chosen so as to impose bounds on the false-acceptance or false-rejection rate. We then compute the average difference between the utility score for a given threshold choice and the average utility score over the complete range of threshold values. As can be seen in the graph of utility vs. threshold distance, the utility-threshold curve can vary significantly for different classes of data in the same dataset.
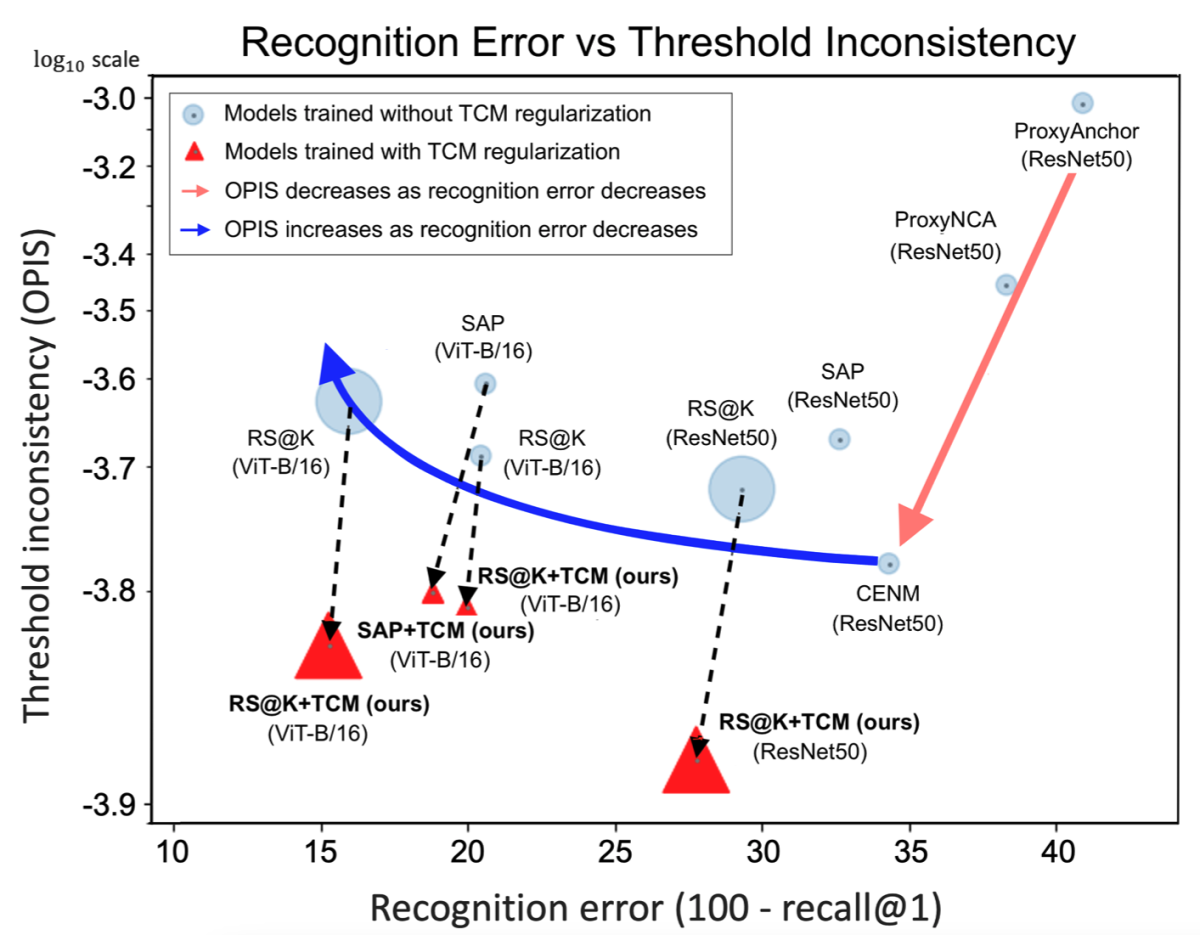
To gauge the relationship between performance and threshold consistency, we trained a series of models on the same dataset using a range of different loss functions and batch sizes. We found that, among the lower-accuracy models, there was indeed a correlation between accuracy and threshold consistency. But beyond an inflection point, improved performance came at the cost of less consistent thresholds.
Better threshold consistency
To improve threshold consistency, we introduce a new regularization loss for DML training, called the threshold-consistent margin (TCM) loss. TCM has two parameters. The first is a positive margin for mining hard positive data pairs, where “hard” denotes data items of the same class with small cosine similarity (i.e., they’re so dissimilar that it is hard to assign them to the same class). The second is a negative margin for mining hard negative data pairs, where “hard” indicates data points of different classes with high cosine similarity (i.e., they’re so similar that it is hard to assign them to different classes).
After mining these hard pairs, the loss term imposes a penalty that’s proportional to the difference between the measured distance and the parameter for the hard pairs exclusively. Like the calibration range, these values can be designed to enforce bounds on the false-acceptance of false-rejection rates — although, because of distribution drift between training and test sets, we do recommend that they be tuned to the data.
In other words, our TCM loss term serves as a “local inspector" by selectively adjusting hard samples to prevent overseparateness and excessive compactness in the vicinity of the boundaries between classes. As can be seen in the figure below, which compares the utility-threshold curves for a model trained using our loss function to one trained without it, our regularization term improves the consistency of threshold distances across data classes.
Below are the results of our experiments on four benchmark datasets, using two models for each and two versions of two loss functions for each model:
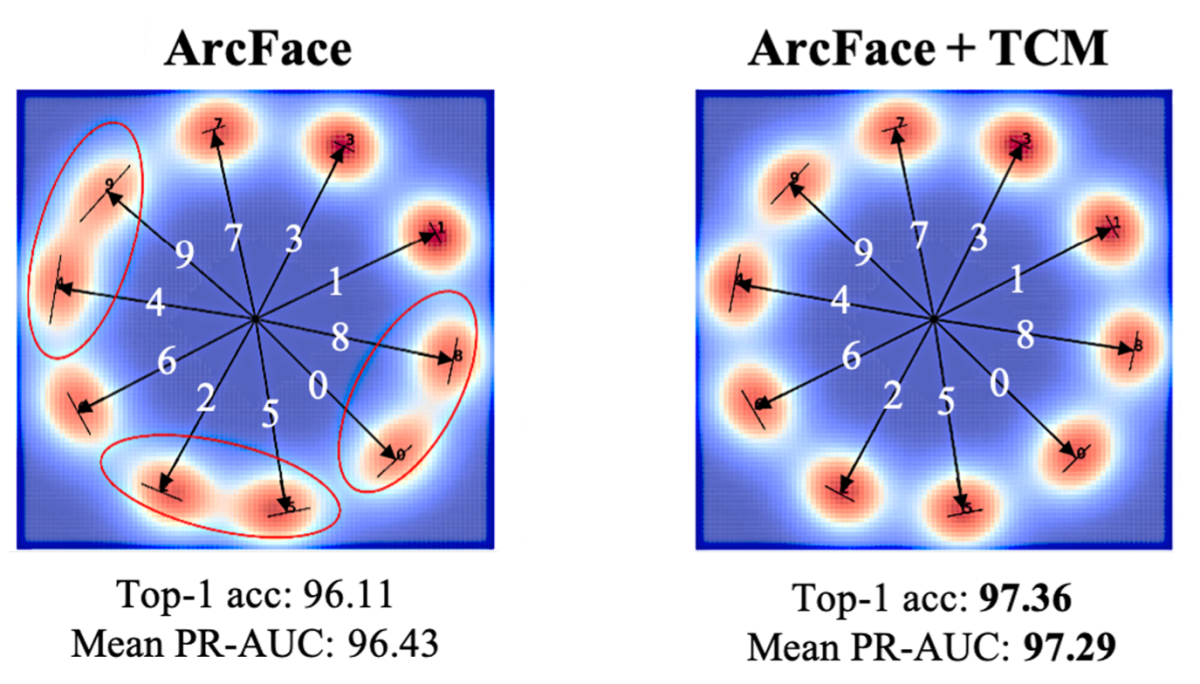
We also conducted a toy experiment using the MNIST dataset of hand-drawn digits to visualize the effect of our proposed TCM regularization, where the task was to learn to group examples of the same digit together. The addition of our loss term led to more compact class clusters and clearer separation between clusters, as can be seen in the visualization below:
The addition of our TCM loss term may not lead to dramatic improvements in every instance. But because it can be used, at no added computational cost, with any choice of model and any choice of loss function, the occasions are rare when it wouldn’t be worth trying.


